
Track sale performance from Banner View to Landing Page Visit to Conversion, and compare sale performance between two separate sales.
This document guides you through how to access the reporting features and shows you how to analyze your sales data more effectively.
Accessing the Reports Screen
To access the Reports Screen:
- Navigate to the Sitewide Sales post type in your WordPress admin area.
- Click on the ‘Reports’ submenu.
How Reporting Tracking Works
When the sale is active, a cookie is created for each site visitor.
The cookie tracks whether the visitor views the banner, visits your landing page, or completes checkout. This allows the site owner to see reports on sale performance based on the conversion rate of your banner, landing page, and checkout process.
Included Reporting Data
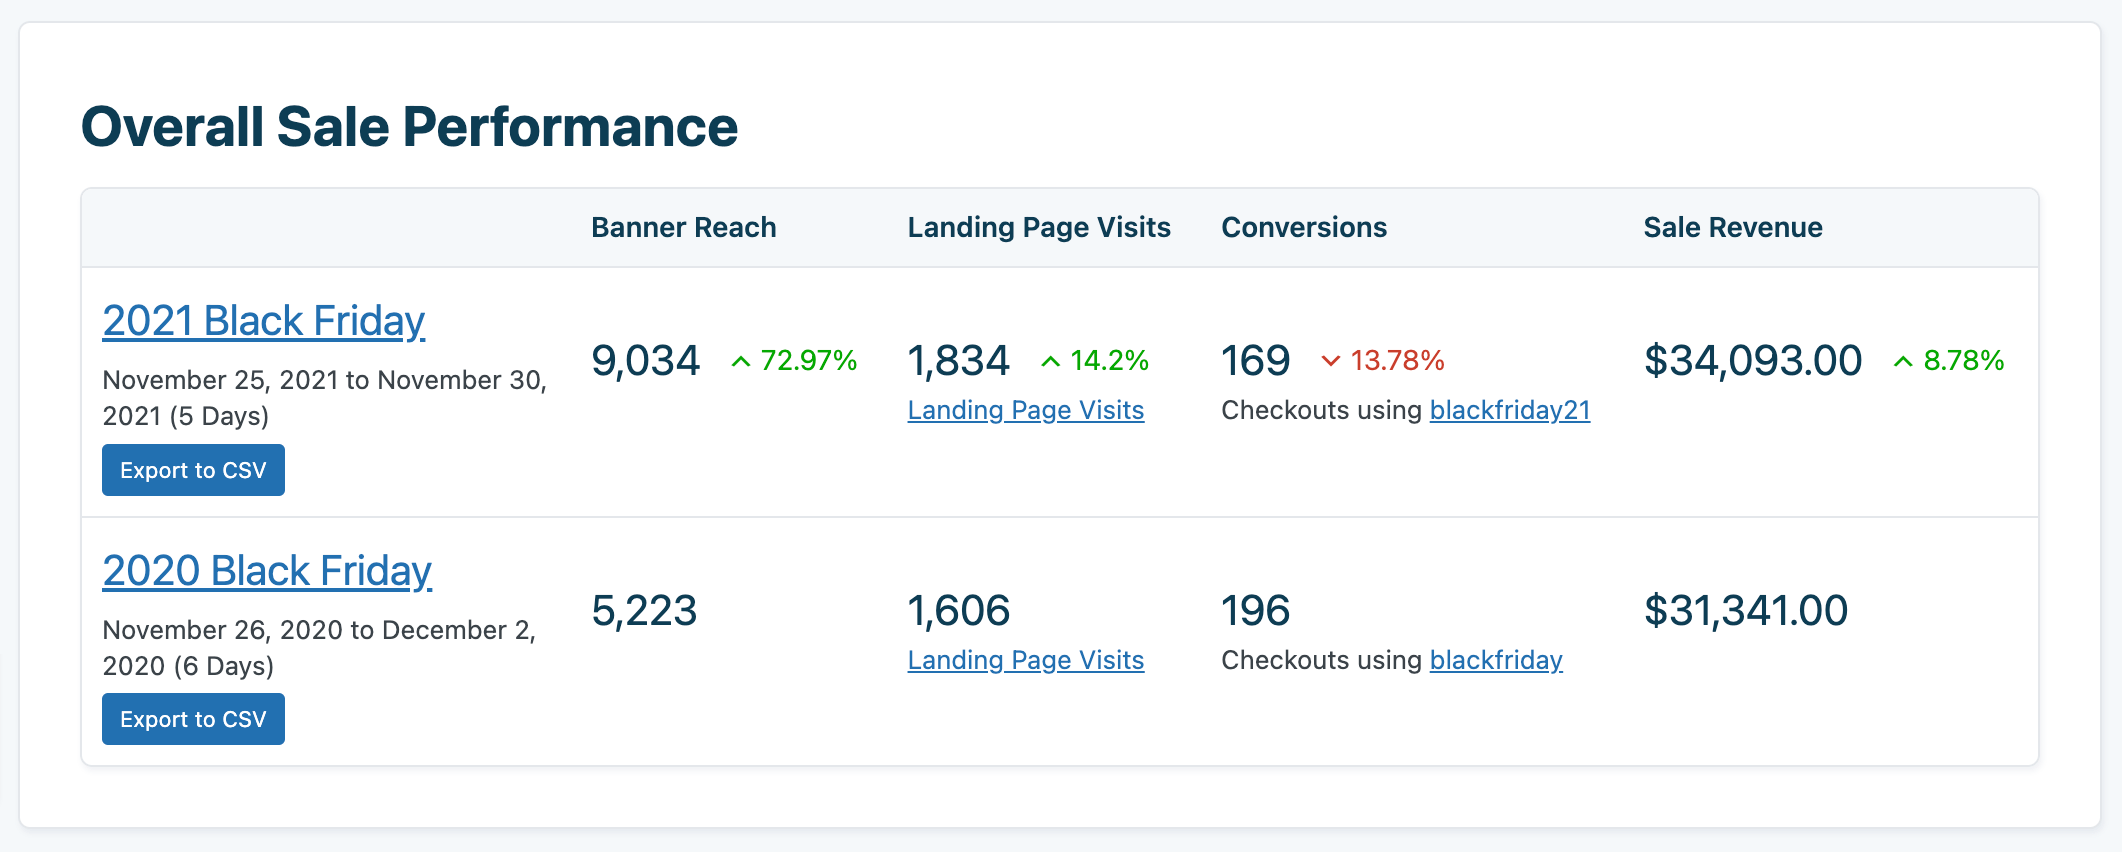
- Banner Reach: Displays the number of times sale banners were viewed.
- Landing Page Visits: Shows the number of visits to your sale landing pages.
- Conversions: Indicates the number of successful sales conversions.
- Sale Revenue: Represents the total revenue generated from the sale.
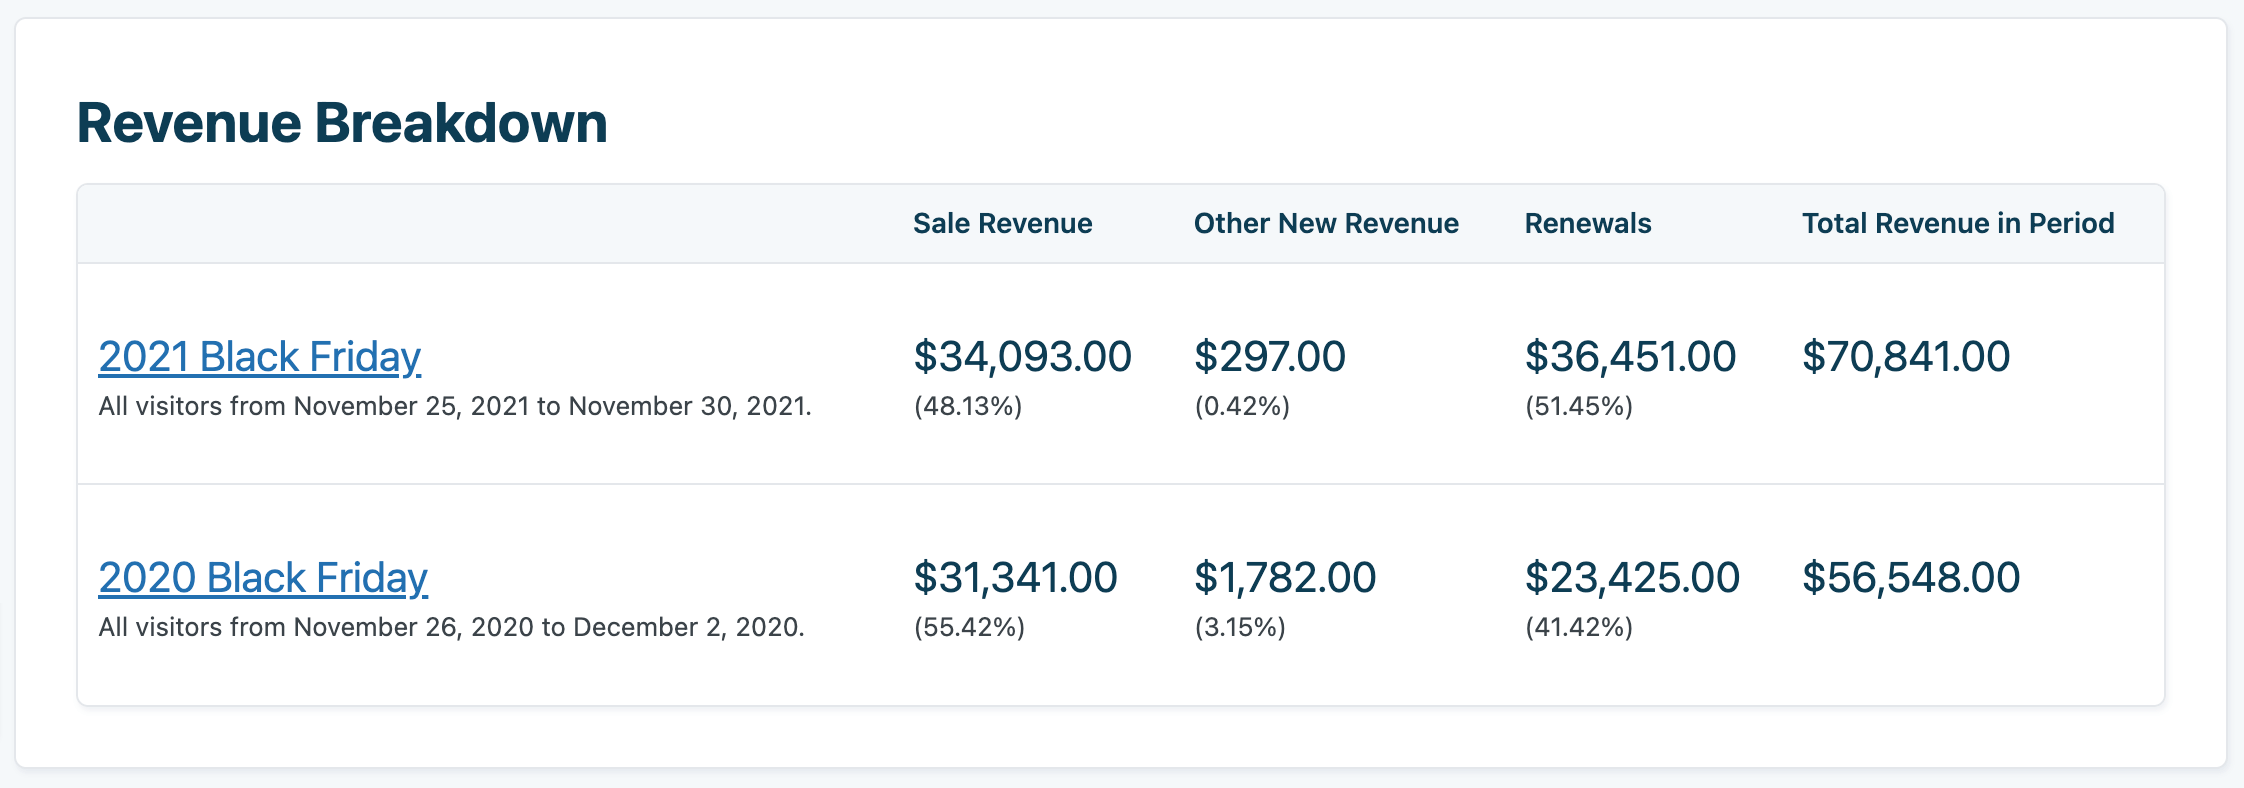
- Revenue Breakdown: A detailed breakdown of revenue, including sale revenue, other new revenue, renewals, and total revenue for the period.
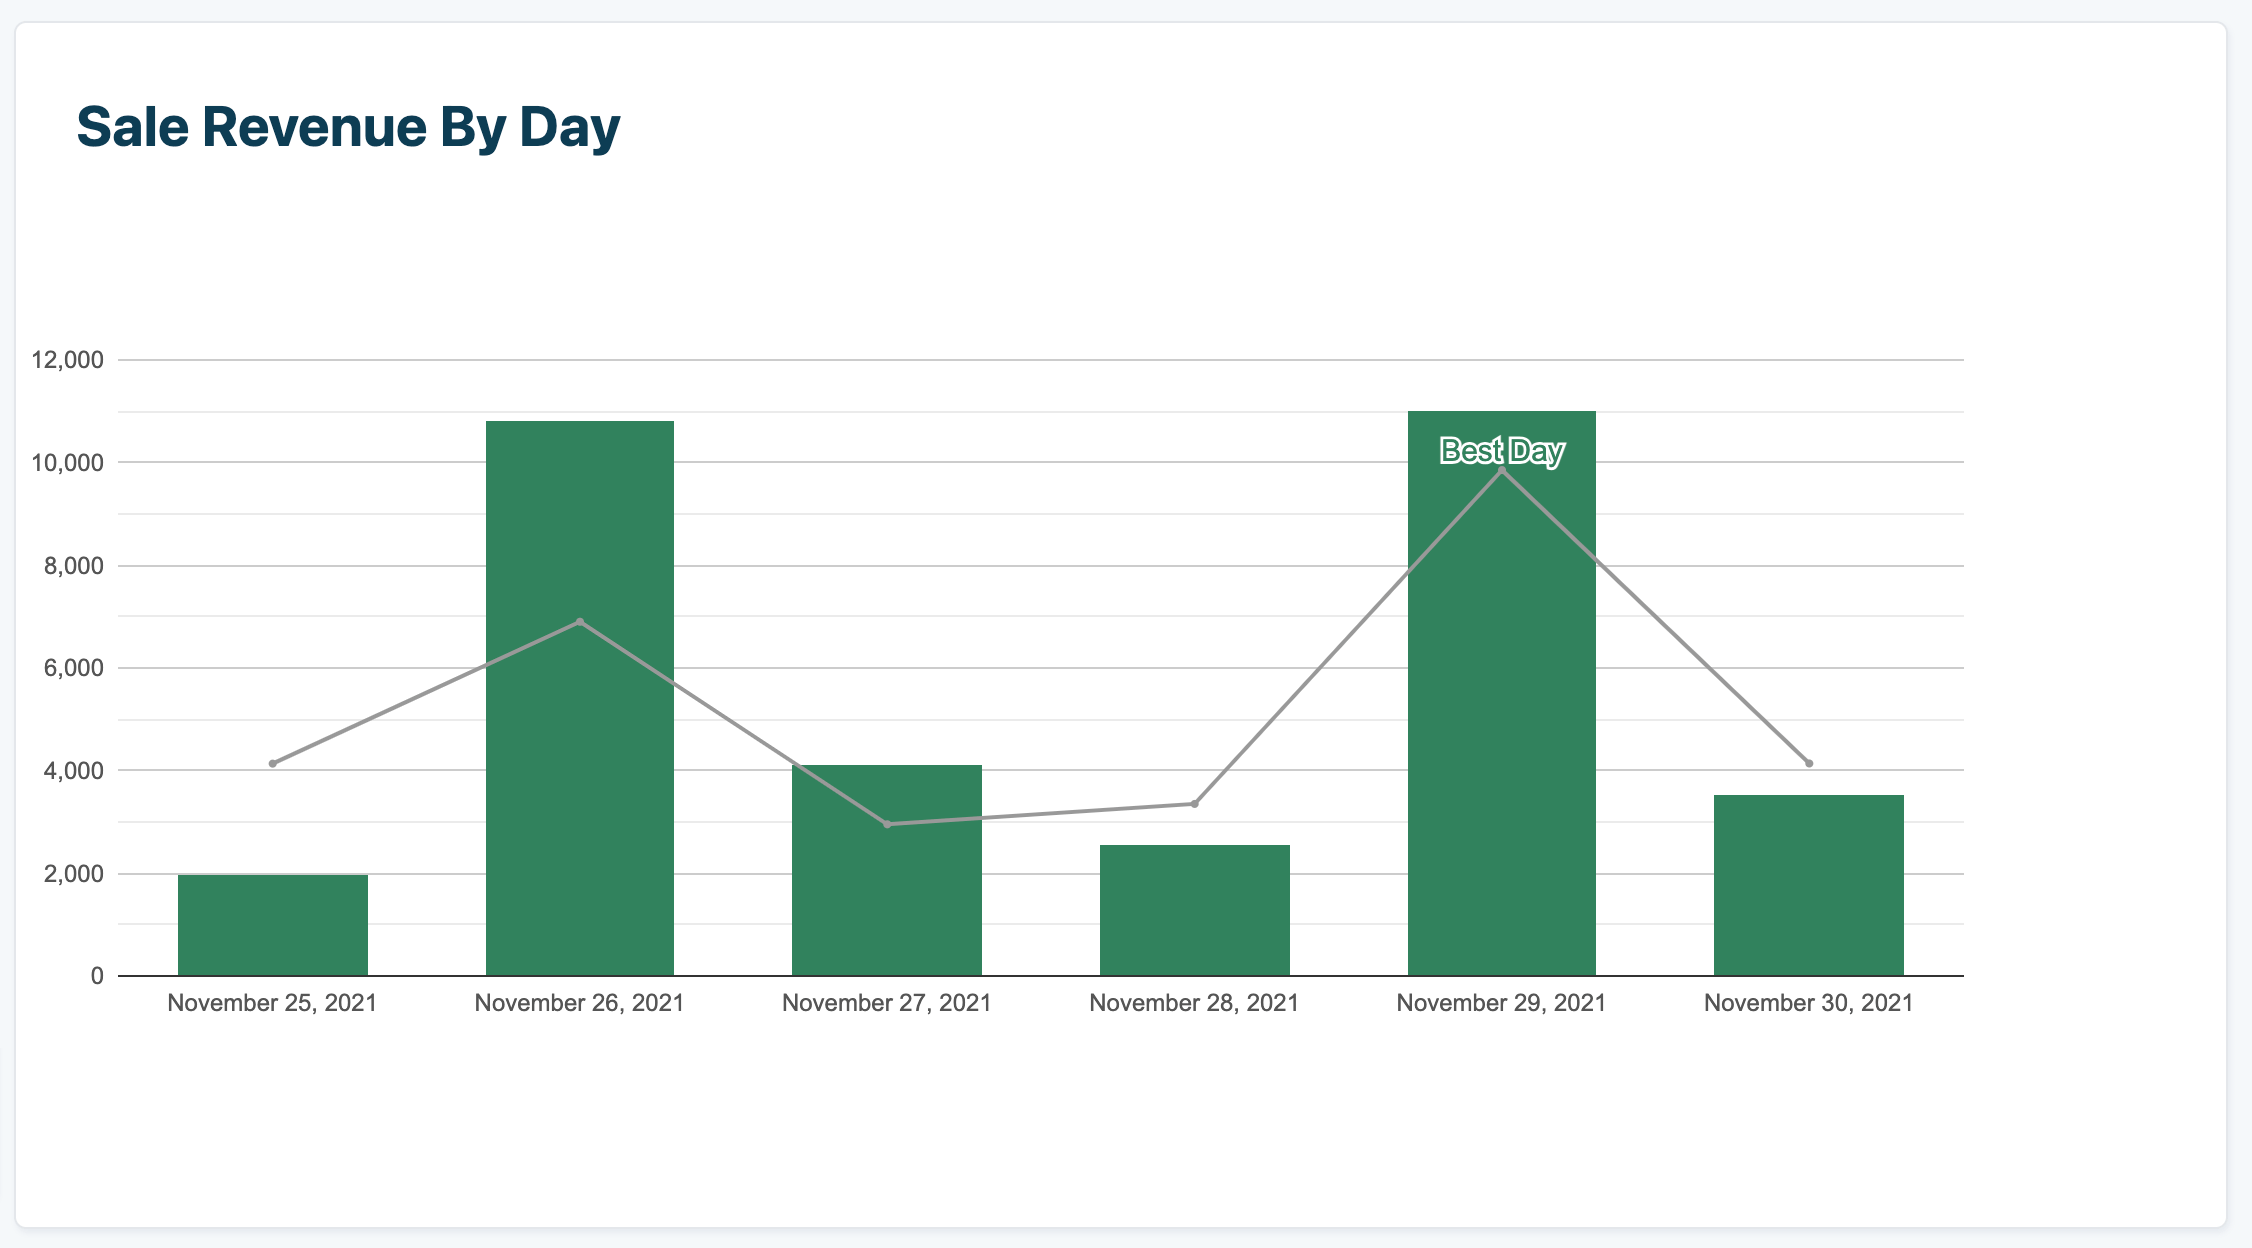
The Reports Screen includes a dynamic chart showing ‘Sale Revenue by Day’. This visual representation helps you quickly grasp the performance over the course of the sale.
Each metric provides a snapshot of performance and can be exported to a CSV file by clicking the ‘Export to CSV’ button for further analysis.
Export Sale Data
The report includes a direct link to export the report data for the sale you’re viewing. This export includes all the metrics on the report, as well as individual daily performance for each day in the sale range.
Sales Comparison Report
The comparison report allows you to compare data between different sales. This can be particularly useful for analyzing trends, identifying performance patterns, and making data-driven decisions to optimize future sales.
How to Generate a Comparison Report
- Go to the Reports Screen as per the instructions above.
- You will see two dropdown menus at the top of the report page labeled ‘Show reports for’ and ‘vs.’.
- Select a sitewide sale from each dropdown to compare two different sales.
- The report will automatically update to display the comparison.
Reports Feature Summary
The Reports Screen in Sitewide Sales is designed to give you a more detailed and comparative view of your sales data. With these tools at your disposal, you can gain deeper insights and make more informed decisions to drive your sales forward.